Chrome DevTools serves as a developer console, offering an array of in-browser tools for constructing and debugging websites and applications.
Among the most valuable features within DevTools is the ability to capture a series of screenshots during page loading. This capability is immensely beneficial for detecting bugs and unexpected behavior in page elements during the construction process. It's also useful for identifying the appearance of spinners or progress bars upon loading, particularly if you possess such rapid internet connectivity that visual tracking becomes challenging.
Steps to Capture a Series of Screenshots on Page Load
1. Open the developer panel using the F12 key.
2. Access the Network tab.
3. Click on the gear icon located in the upper right corner of the panel.

4. Activate the "Capture screenshots" checkbox.
5. Press Ctrl+R to initiate the page reload.

A sequence of screenshots will populate at the top of the window. Clicking on any of these screenshots enables sequential viewing, complete with timestamps. This allows you to track the appearance of each element on the page during the loading process.

Another noteworthy and indispensable feature of DevTools, particularly for performance testing, is the identification of unused CSS and JavaScript code in layouts.
Why is "extra" code problematic? Every instance of code, including the unused portions, undergoes examination by the browser upon page loading. The presence of excessive unused code can significantly extend page loading times. Moreover, for users accessing the site from mobile devices, this redundant code consumes additional mobile data, an undesirable outcome.
DevTools allows you to identify all unused code and subsequently provide this insight to developers via bug reports. This process might lead to the discovery of unnecessary code segments. By eliminating these segments, developers can enhance the overall performance of the site.
Steps to Identify Unused CSS and JS in Layout
1. Open the developer panel using the F12 key and summon the Command Menu using Ctrl+Shift+P.
2. Enter "Show Coverage" and press Enter. This will open the Coverage tab.
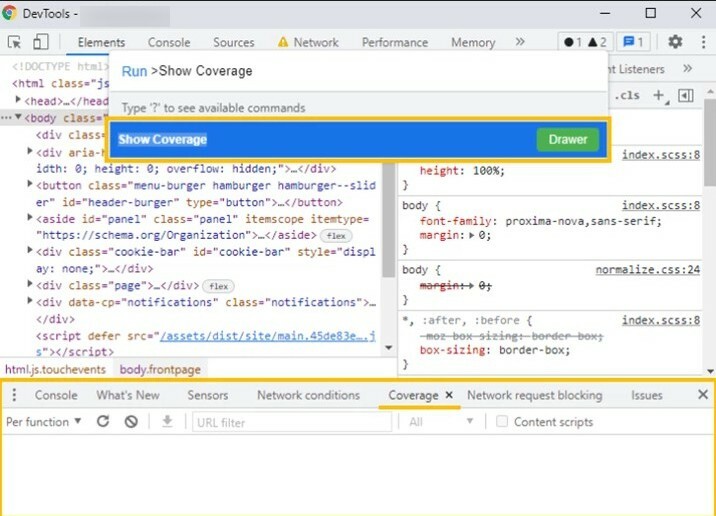
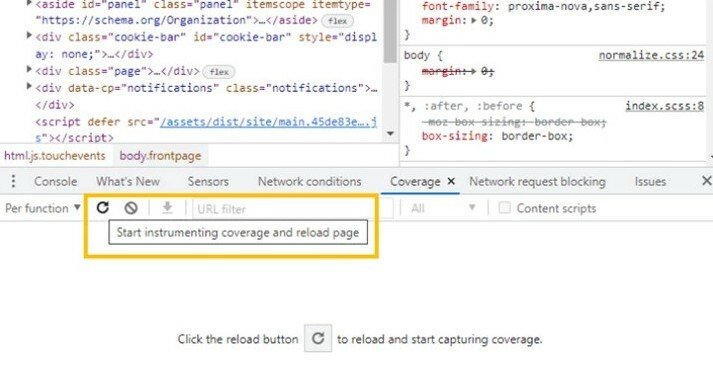
3. Click the "Start instrumenting coverage and reload page" button.
4. Subsequently, a table will display within DevTools, illustrating functions (or blocks) with unused code quantities on the page.

5. Select one of the items. As a result, the corresponding code with color markers will be visible on the Sources tab.
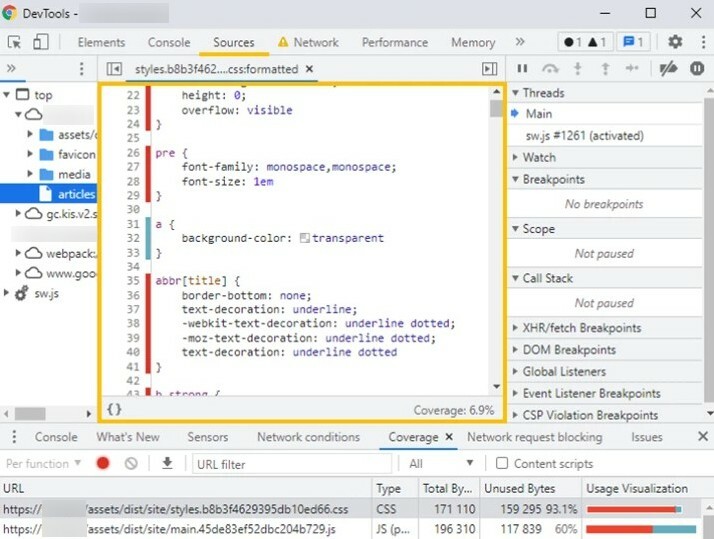
Unused code is indicated by a red marker. On a specific project, this approach enabled us to identify excessive Google fonts, which were substantially burdening the page and causing performance issues. Consequently, the developers optimized the code by removing unnecessary fonts, leading to a more efficient website.
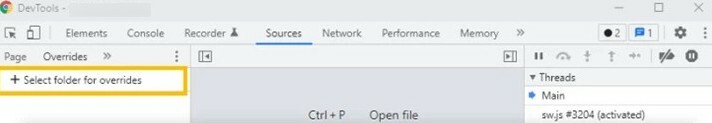
Most people are aware that through DevTools, you can modify page styles, alter fonts, adjust colors, add or remove images, insert text, and more. Yet, not everyone knows how to make these changes persist beyond page reloads. This is where local overrides come into play, functioning effectively for most file types with some exceptions, which we'll address later in the "Limitations" section.
Steps to Save Changes Locally:
1. Open the developer panel using the F12 key.
2. Access the Sources tab.
3. In the files panel on the left, navigate to the Overrides tab.
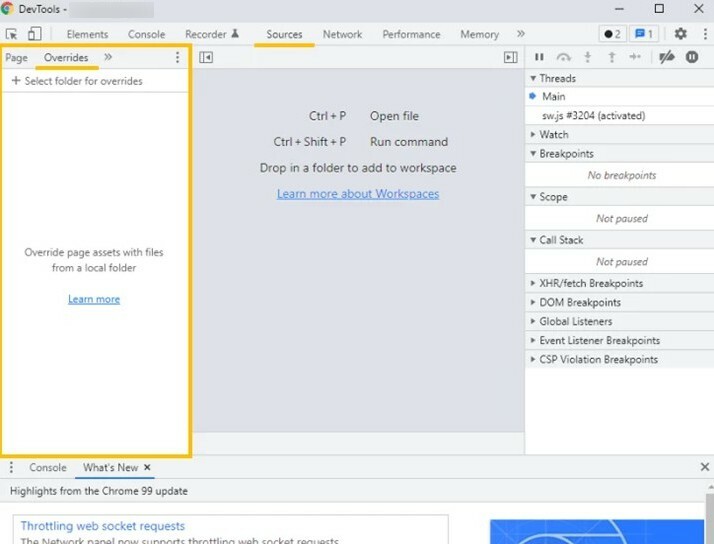
4. Click the "Select folder for overrides" button.
5. Choose a folder to store your page changes.
6. In the pop-up window, grant DevTools access to the selected folder.

7. Locate the page code file in the Network tab. To do this, reload the page and sort by "Doc." Often, this file is named index.html. In our example below, it's named Projects.

8. Right-click on this file and save it as "Save for overrides."

You can now make changes to the code that will persist even after reloading the page.
9. To do this, locate the desired element's code in the Elements tab using a specialized tool (Ctrl + Shift + C) and copy it.
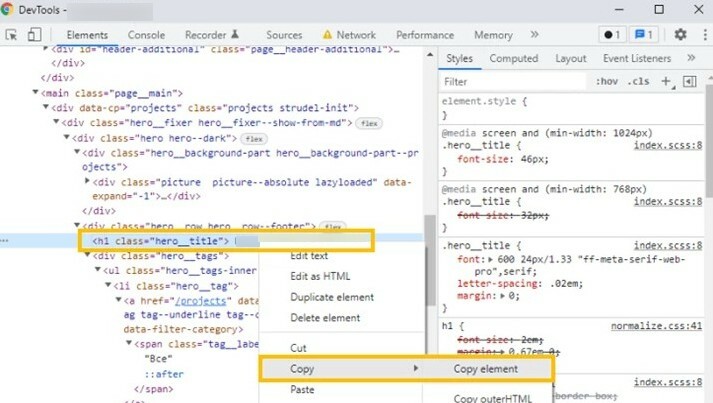
10. Find the copied element in the Sources tab of the page code document (press Ctrl + F to open the search bar).
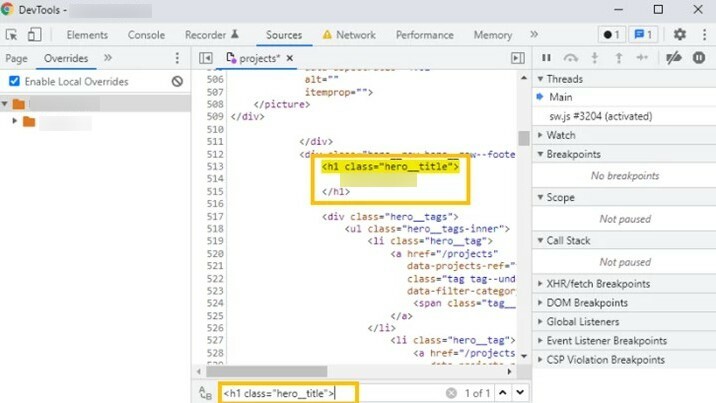
11. Make changes to it and press Ctrl + S to save. Then reload the page.
Limitations: DevTools doesn't retain changes made to the DOM tree in the Elements tab. Only the page code file in the Sources tab is editable. However, if CSS is not embedded in the page code file, you can still edit and save it in the Styles tab.
Returning to the "Finding Unused CSS and JS in the Layout" section of our article: Local overrides enable you to personally remove identified "extra code" and observe its impact on page loading speed. Furthermore, if you're somewhat skilled in development, you can attempt to optimize existing code. For instance, you could reorder blocks and gauge their effect on performance.
We've already learned how to monitor page loading through screenshots (as detailed in the "Screenshots on Page Load" section). But what if certain content fails to load, like an image or a crucial animation? How can we assess this scenario?
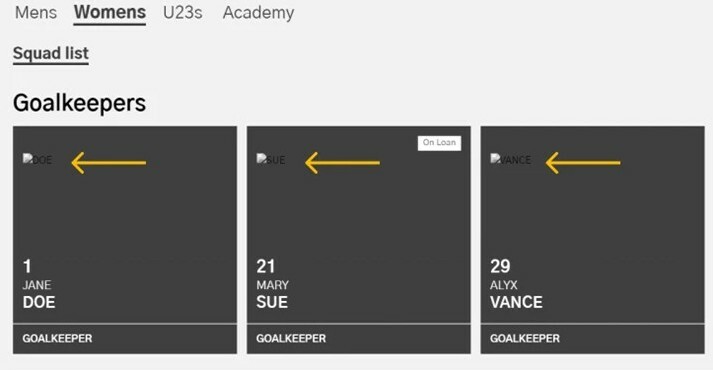
To investigate, you can utilize DevTools to block specific requests. This approach proves useful when checking if developers neglected to set alternative text for images, which should display in case a picture fails to load or is missing.
Steps to Block Specific Requests:
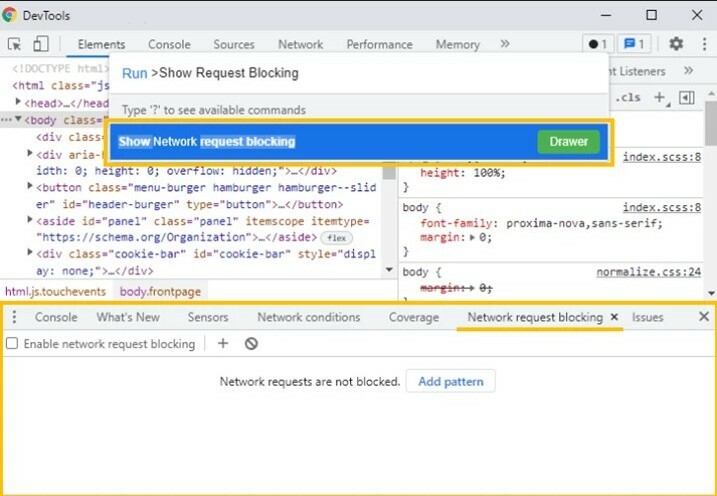
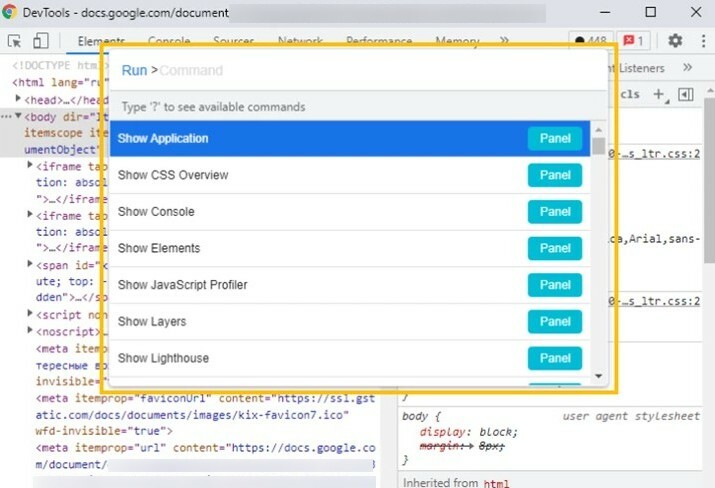
1. Open the developer panel using the F12 key and invoke the Command Menu using Ctrl + Shift + P.
2. Enter "Show Request Blocking" and choose "Show Network Request Blocking." This action opens the Network Request Blocking panel below.
3. Within the Network tab, select the element for which you wish to block the request.
4. Copy the request from the Headers menu and click the "Add Pattern" button in the Network Request Blocking panel.
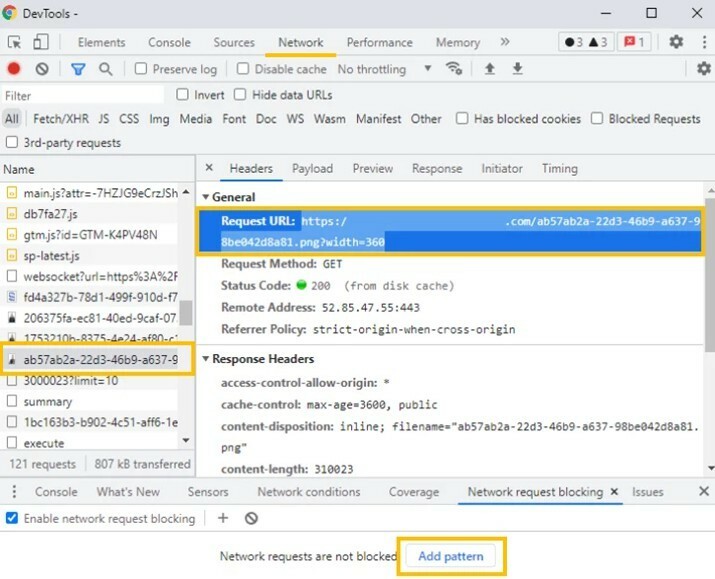
5. Paste the request into the Network Request Blocking menu and click "Add."
6. Ensure that both the request's checkbox and the "Enable network request blocking" checkbox are activated.
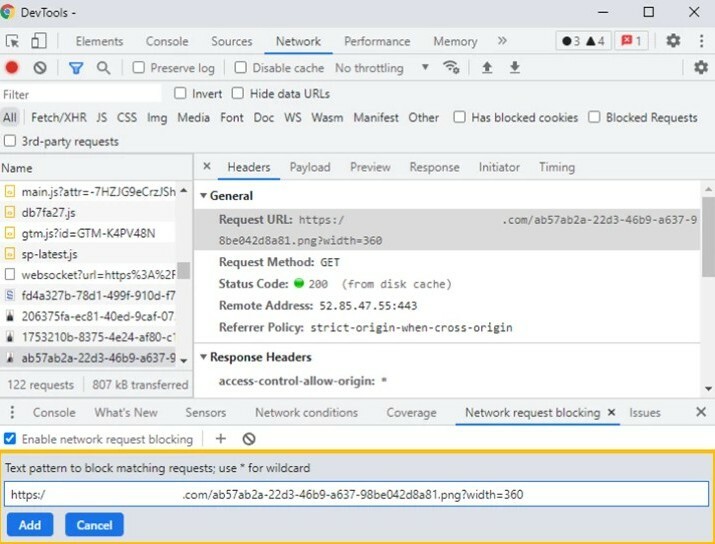
7. Reload the page to observe the changes. Now you'll see that where we blocked requests for images, alternative text appears:
DevTools offers the capability to override a user's location, allowing you to assess how the site appears to residents of various cities, countries, and time zones. Wondering if a visitor from Europe viewing the game schedule on the website of a Canadian hockey club factors in the correct time zone? With DevTools, you can override geolocation to find out.
Attention! This method suits sites and services that determine visitor location through geolocation services, not, for instance, solely via IP addresses.
Steps to Change Geolocation in DevTools:
1. Open the developer console (F12) and access the Command Menu using Ctrl + Shift + P.
2. Input the "Sensors" command and choose "Show Sensors" from the list. This will unveil the Sensors tab at the bottom of DevTools.
3. Proceed within the Sensors tab. In the Location field, you can pick from a dropdown list of existing cities.
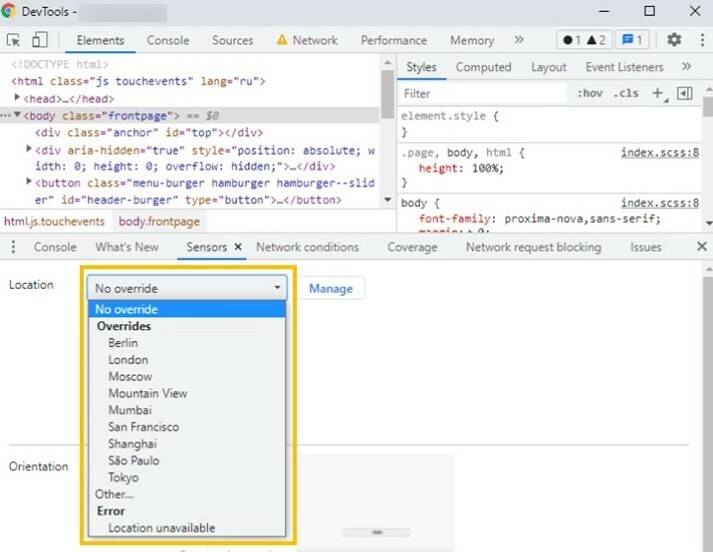
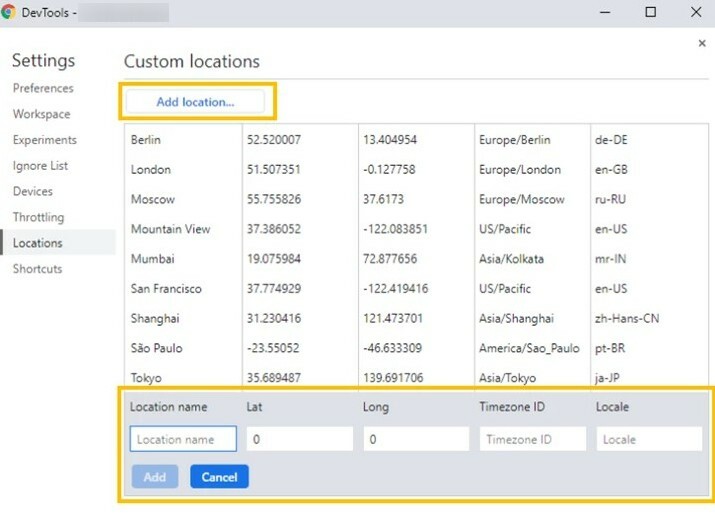
If your desired city isn't present, click the Manage button next to the available locations dropdown list. Then, opt for "Add Location" and input the city's name, coordinates, and time zone.
This DevTools feature proved invaluable when we were developing a website for a British football club. We needed to verify if the visitor's geolocation was properly considered on the page displaying upcoming game schedules.

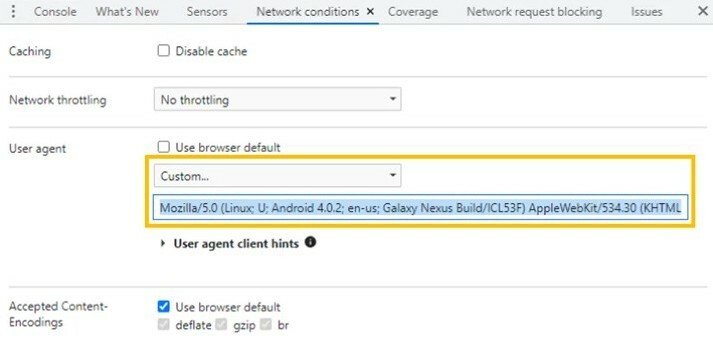
User-Agent is a string that informs the site about the software the visitor employs. It records device details (PC, tablet, smartphone), operating system, and browser. Based on these factors, the site may present differently. Designers, for instance, adapt designs and styles for mobile versions, streamline animations to ensure content is accessible on smaller smartphone screens. To inspect whether site styles adjust according to various devices, OS, and browsers, you needn't be surrounded by a plethora of devices like Macs, iPhones, or tablets. Instead, you can modify the User-Agent within DevTools to examine the site from a single device.
Steps to Change User-Agent in DevTools:
1. Open the developer panel (F12) and initiate the Command Menu using Ctrl + Shift + P.
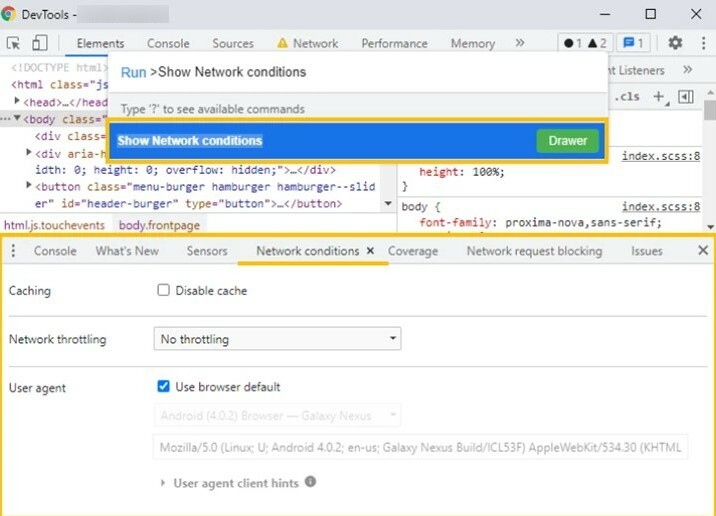
2. Input "Show Network conditions" and press Enter. This will display the Network conditions tab at the bottom of DevTools.
3. In the User-Agent field, uncheck "Use browser default."
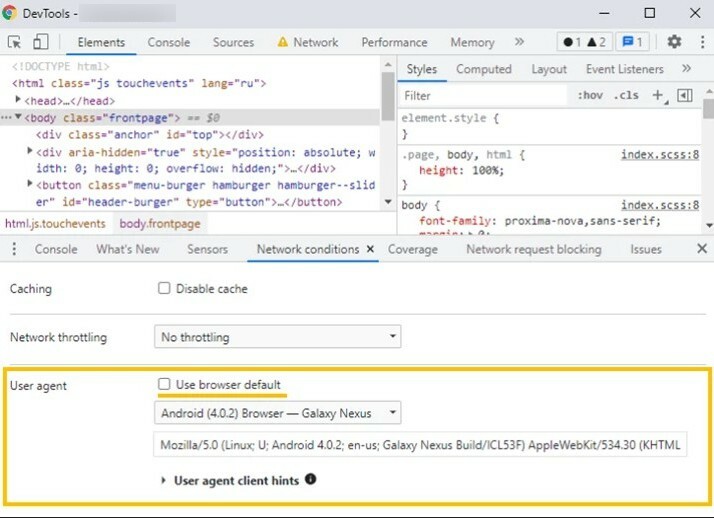
4. Subsequently, pick the desired User-Agent from the dropdown list below.

If your needed User-Agent isn't available, you can manually input the data. To do so, select "Custom" from the dropdown list and enter the parameters in the line below.
The six features we discussed in this article only scratch the surface of what DevTools can accomplish in the hands of a skilled QA specialist. There are countless other intriguing functionalities that prove invaluable for testing websites and applications.

It's easy to start working with us. Just fill the brief or call us.

Dmitry Bastron
We will take you on a journey through a real-life scenario of implementing advanced tracking and analytics using Kentico Xperience 13 DXP.
Dmitry Bastron
We would like to share our experience of integrating Sitecore 9.3 with the Azure AD B2C (Azure Active Directory Business to Consumer) user management system.
Dmitry Bastron
We'll dive into practical implementation in your Xperience by Kentico project. We'll guide you through setting up a custom activity type and show you how to log visitor activities effectively.

Anastasia Medvedeva
Kentico stands as one of our principal development tools, we believe it would be fitting to address why we opt to work with Kentico and why we allocate substantial time to cultivating our experts in this DXP.

Anna Gevel
As a software development company, we at Byteminds truly believe that learning and sharing knowledge is one of the best ways of growing technical expertise.
Anastasia Medvedeva
Our expertise spans full-scale builds and support to upgrades and replatforming.
Anastasia Medvedeva
Since 2015, we've been harnessing Kentico's capabilities well beyond its core CMS functions.
Anastasia Medvedeva
Our team boasts several developers experienced in working with Umbraco, specialising in development, upgrading, and replatforming from other CMS to Umbraco.

Sergei Pestov
How to stop declining of the performance indicators of your ecommerce website and perform optimising page load performance.
Anna Gevel
We've collected various findings around decision models and programmable nodes working with Sitecore Personalize.
We will explain how these agreements differ from one another and what projects they are suitable for.
Let's talk about what enterprise development is, what nuance enterprise projects may have, and which skills you need to acquire to successfully work within the .NET stack.

Andrey Stepanov
All you need to know about Headless CMS. We also share the knowledge about benefits of Headless CMS, its pros and cons.
We'll consider the top-to-bottom approach for modeling content relationships, as it is more user-friendly for content editors working in the Kontent.ai admin interface.
Anna Gevel
One of the first things I tested in Sitecore XM Cloud was embedded tracking and personalisation capabilities. It has been really interesting to see what is available out-of-the-box, how much flexibility XM Cloud offers to marketing teams and what is required from developers to set it up.